
Mac OS ROM Debugger (MicroBug)

27 May 2021
Before I knew what the debugger window was, I would often clumsily hit command + power on my PowerBook 1400 (the Power key is placed above the delete key) while working on something. I couldn't figure out how to close it and would end up having to restart the computer losing all of my unsaved work.
After stumbling across a forum topic on Ars Technica I finally found some useful information.
ROM Debugger |
Purpose of the MicroBug
MicroBug is a debugging interface that allows you to access details of whatever is currently running on the CPU, or a given memory location.
Triggers
The debugger window can be triggered by pressing the command + power key combination on PowerBooks/portable Macs. It can also be triggered by pressing the 'Programmer's Button' on a desktop Mac, usually located beside the reset button.
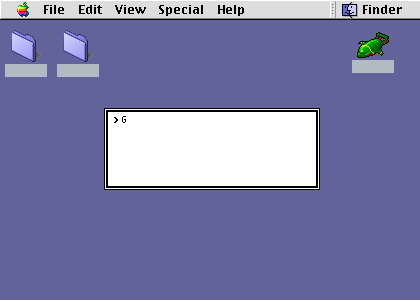
Interacting with the MicroBug
The 'G' command followed by an instruction tells the interface to begin executing the given instructions at this offset.
For example, you could enter G $0C30 to look up the the memory contents at the given address.
Entering G followed by a string looks for the represented address within the current running process/program.
MicroBug can be extended by installing MacsBugs (Motorola Advanced Computer System Debuger). This adds commands which can be more useful to developers. Example: The command ES (Exit to shell) can be run if the computer crashes, and in some cases can bring you out of the crashed state.
Closing the debugger
Entering G by itself tells the interface to resume the current process at the default location - which closes the debugger.
Entering G followed by any incorrect string such as G FINDER will terminate the current running process and also close the debugger window.
For more information and an interesting read, see Apple's Technical Note about MicroBug.
Post a Comment